The perceptron is a binary classifier, so we will consider two flower classes from the Iris dataset for practical reasons. The preceptron algorithm can be extended to multi-class classification using the One vs All (OvA) method (where one class is treated as the positive class and all other classes are the negative class).
It’s very important that the feature pair seems roughly linearly separable when judging whether a perceptron is a good choice.
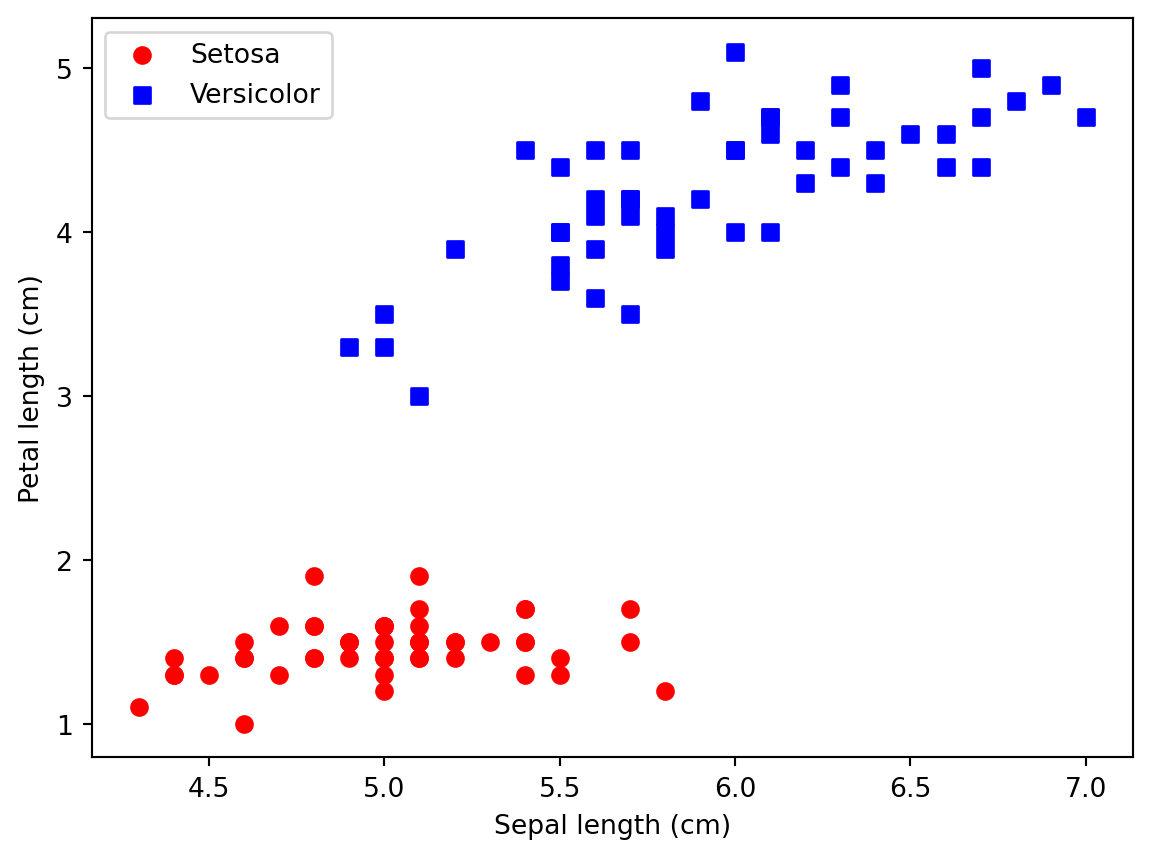
import osimport pandas as pdimport matplotlib.pyplot as pltimport numpy as nps ='https://archive.ics.uci.edu/ml/machine-learning-databases/iris/iris.data'df = pd.read_csv(s, header=None, encoding='utf-8') # dataframe# print(df.tail()) # just to ensure that the data was loaded correctlyy = df.iloc[0:100, 4].values # creates a np array (.values) from the species labels (4 == 5th column == species) of the first 100 rowsy = np.where(y =='Iris-setosa', 0, 1) # 0 if setosa, 1 if versicolor (first 100 rows only have those two species)X = df.iloc[0:100, [0, 2]].values # 100 x 2 matrix that extracts two features: sepal length (0) and petal length (2)# Plot the two iris classes in the 100 x 2 matrix to visualize how separable they are before fitting a perceptron# It's important that it's roughly linearly separable, which is when a perceptron would be a good choiceplt.scatter(X[:50, 0], X[:50, 1], color='red', marker='o', label ='Setosa')plt.scatter(X[50:100, 0], X[50:100, 1], color='blue', marker='s', label ='Versicolor')# Note that the x-axis here would be sepal length (because it's in column 0) and y-axis would be petal length (column 1)plt.xlabel('Sepal length (cm)')plt.ylabel('Petal length (cm)')plt.legend(loc='upper left')plt.show()
Seems like a linear decision boundary is possible, which means that a perceptron can classify this dataset perfectly.
A perceptron would be an example of a linear classifier
Personal Notes
I shipped UI improvements to the reader project. Rick Rubin was right - ship improvements to the product by focusing on what I want and need, and hope that there will be others who want the same.
Questions I still have
When implementing the code, I spent a lot of time trying to figure out why the author wrote each line the way that he did. It made me wonder how much of ML is printing out tails of datasets and plotting data to visualize it as a sanity check.
Tomorrow’s plan
Finish implementing the perceptron to classify the Iris dataset.