Daily Notes: 2025-12-21

daily
Published

December 21, 2025

ML Notes

Logistic Regression

Logistic Regression

import numpy as np
import matplotlib.pyplot as plt

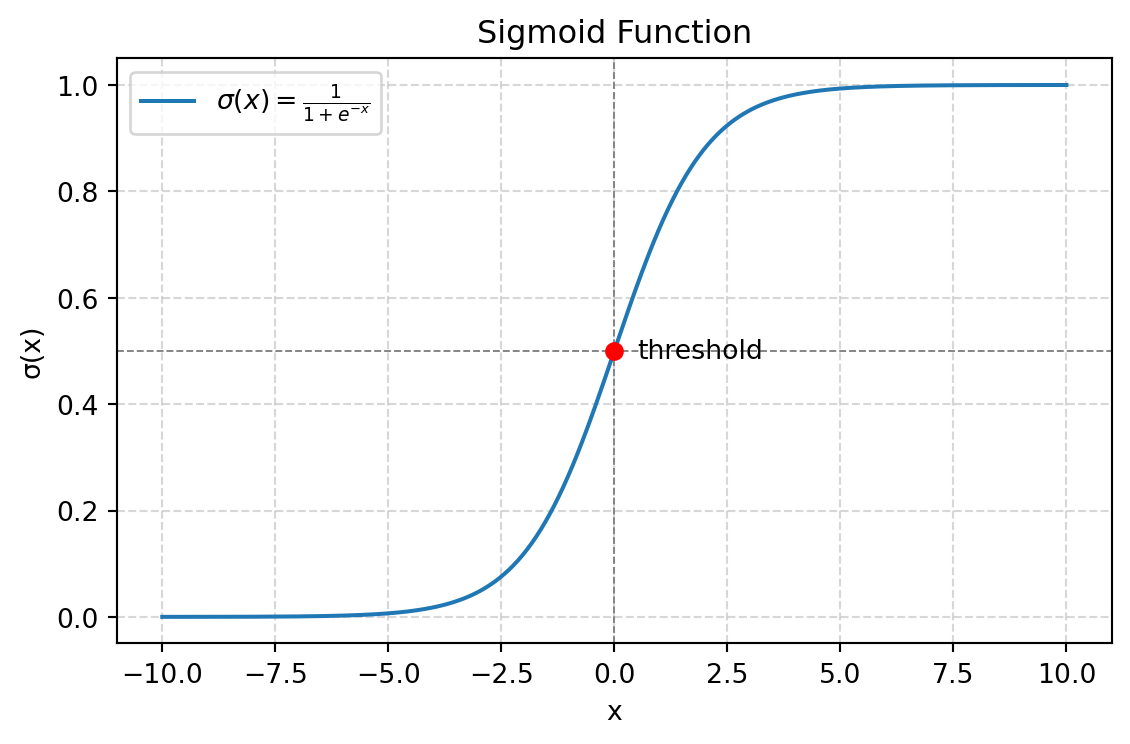
def sigmoid(x: np.ndarray) -> np.ndarray:
    return 1 / (1 + np.exp(-x))

x = np.linspace(-10, 10, 400)
y = sigmoid(x)

plt.figure(figsize=(6, 4))
plt.plot(x, y, label=r'$\sigma(x) = \frac{1}{1 + e^{-x}}$')
plt.axvline(0, color='gray', lw=0.7, ls='--')
plt.axhline(0.5, color='gray', lw=0.7, ls='--')
plt.scatter([0], [0.5], color='red', zorder=5)
plt.text(0.5, 0.5, 'threshold', va='center')
plt.xlabel('x')
plt.ylabel('σ(x)')
plt.title('Sigmoid Function')
plt.legend()
plt.grid(True, ls='--', alpha=0.5)
plt.tight_layout()
plt.show()

Consider the sigmoid function, which is popular within AI because it squashes \(x\) to be a number between 0 and 1.

\(\sigma(x) = \frac{1}{1 + e^{-x}}\)

Consider the weighted sum (aka dot product) which is:

\(\theta^{T}x = \sum_{i=1}^{m}\theta_{i}x_{i}\)

Therefore the sigmoid function of the weighted sum is:

\(\sigma(\theta^{T}x) = \frac{1}{1 + e^{-\theta^{T}x}}\)

  • The “lightbulb idea” behind logistic regression is predicting \(P(X | Y)\) directly (more rigorously than a Naive Bayes Classifier).
  • Logistic regression predicts discrete (e.g., True vs. False) rather than continuous values. It fits a function resembling a sigmoid function to the data.
  • Instead of least squares as a cost function, it uses maximum likelihood

Personal Notes

Questions I still have

Tomorrow’s plan